WHAT PROBLEM ARE WE TRYING TO SOLVE AND WHY?
How might we allow an organization to achieve full allocation of cloud costs?
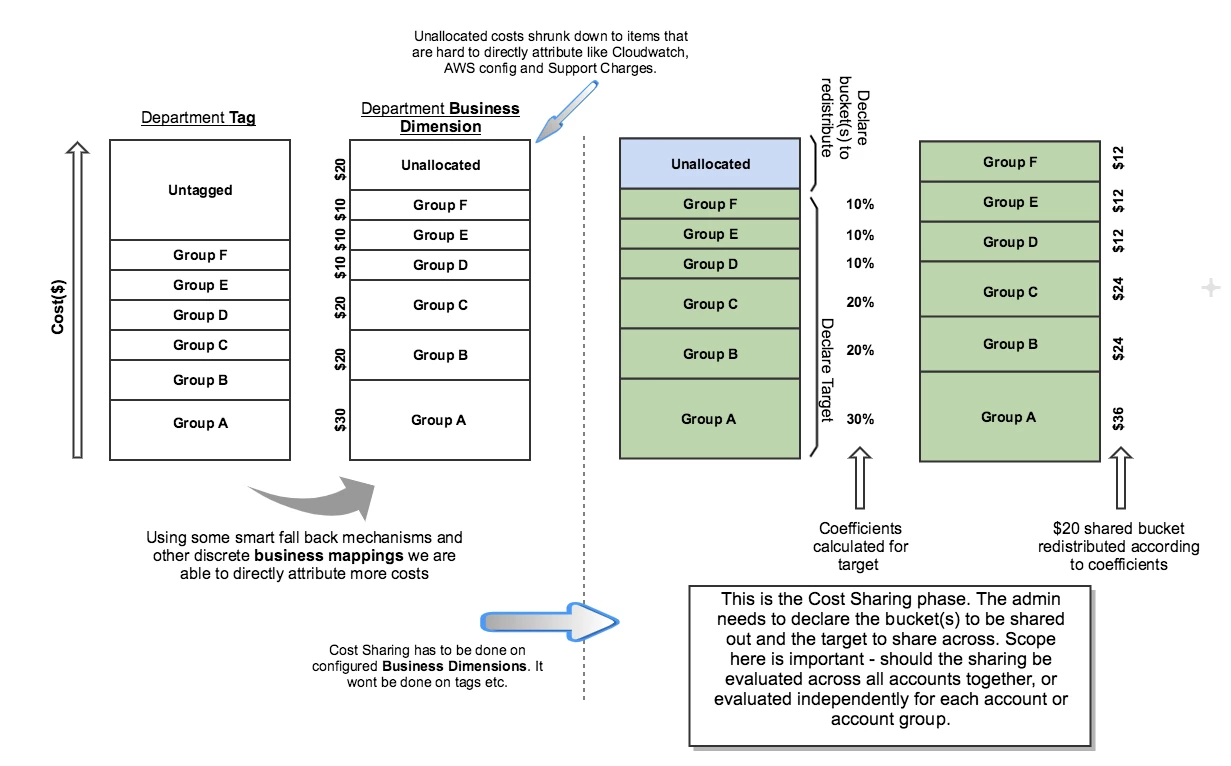
Cloud costs have historically been difficult to allocate due to:
- Billing reports being thousands of lines long and difficult to comprehend.
- Many cloud costs are untaggable costs like support charges, CloudWatch, etc.
- Actual designated shared costs that are used by everyone (ex. email, etc.) are very difficult to track.
MY ROLE & RESPONSIBILITIES
The Team
Senior PM, Senior PD (Me), Engineering Manager, Engineering Lead and four software engineers (front and back-end).
UX Design and Research
Responsible for research, usability testing, user flows, prototyping and all other UX deliverables for the feature.
Visual Design
Owned all visual styling and component creation. Responsible for providing any visual updates to our design system.
WHO ARE WE DESIGNING FOR & WHY?
The target persona for this feature is a member of an org’s finance team (i.e. less cloud/tech savvy). Required to allocate cloud costs to their respective teams, they will typically run cost sharing calculations at the end of each month to configure charge-back. This is currently a manual process.
MEASURES OF SUCCESS
The measures of success for this new feature will be:
90%
Of orgs in the beta rollout engage with Cost Sharing at least once a month.
50%
Of orgs in beta can completely eliminate their old cost sharing process and reliably use this in-app tool, exclusively.
50%
Reduce time spent calculating cost sharing per org.
CURRENT APPROACH & PAIN POINTS
Based on research and interviews with users, we were able to get a better idea of how they are currently manually calculating and implementing cost sharing outside of Cloudability. By solving this problem within Cloudability we are aiming to save our customers time in messy spreadsheets, improve their accuracy and provide institutional-wide awareness of what one's attributed shared cost is in 'real time'.
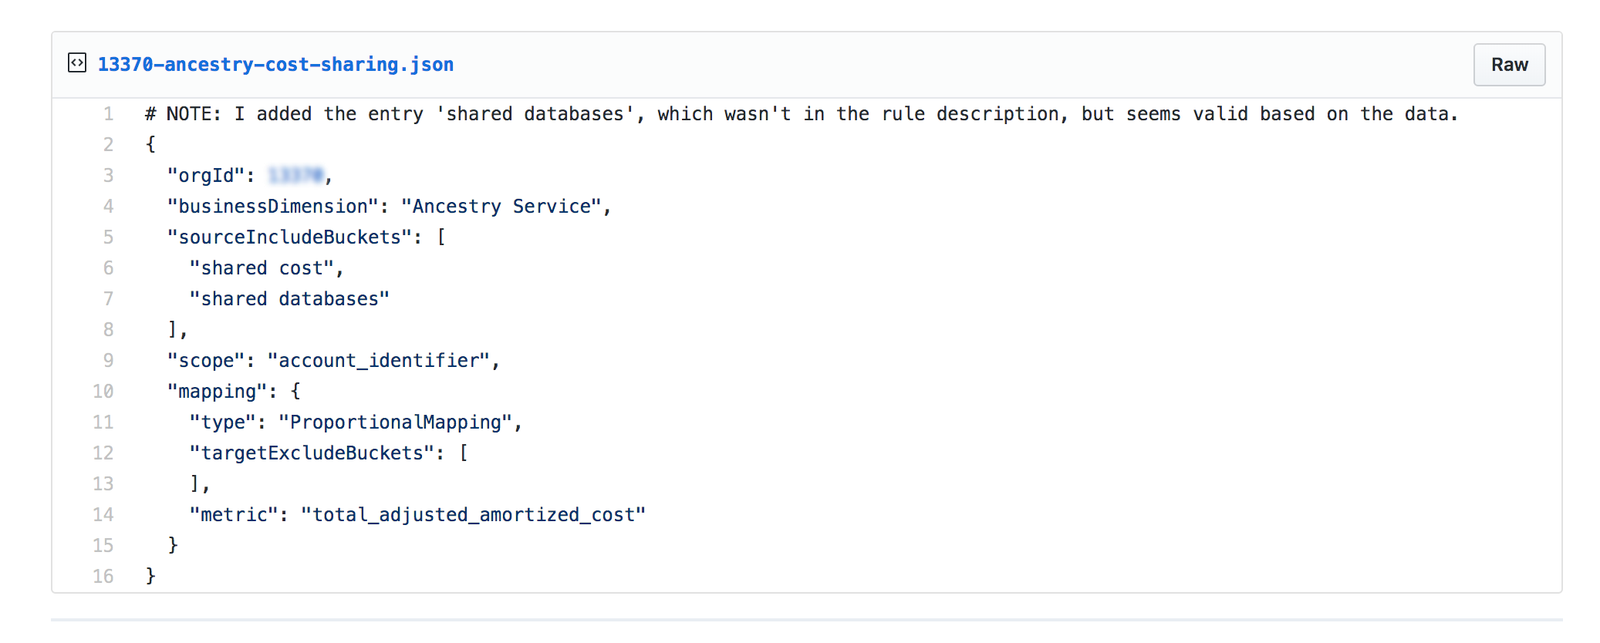
I was also able to collaborate with the engineering team to gather insights from JSON api calls to see how users are currently approaching Cost Sharing from a technical standpoint.
KICKFF & EXPLORATION
Our team had a kick-off meeting to answer any open questions, brainstorm ideas and get a general idea of scope, requirements and constraints. I want to make sure we are on the same page about the problem we are solving and why.
During this exploration, it was discovered that there could possibly be some serious technical limitations to consider when designing a solution for our users, based on the architecture of our app.
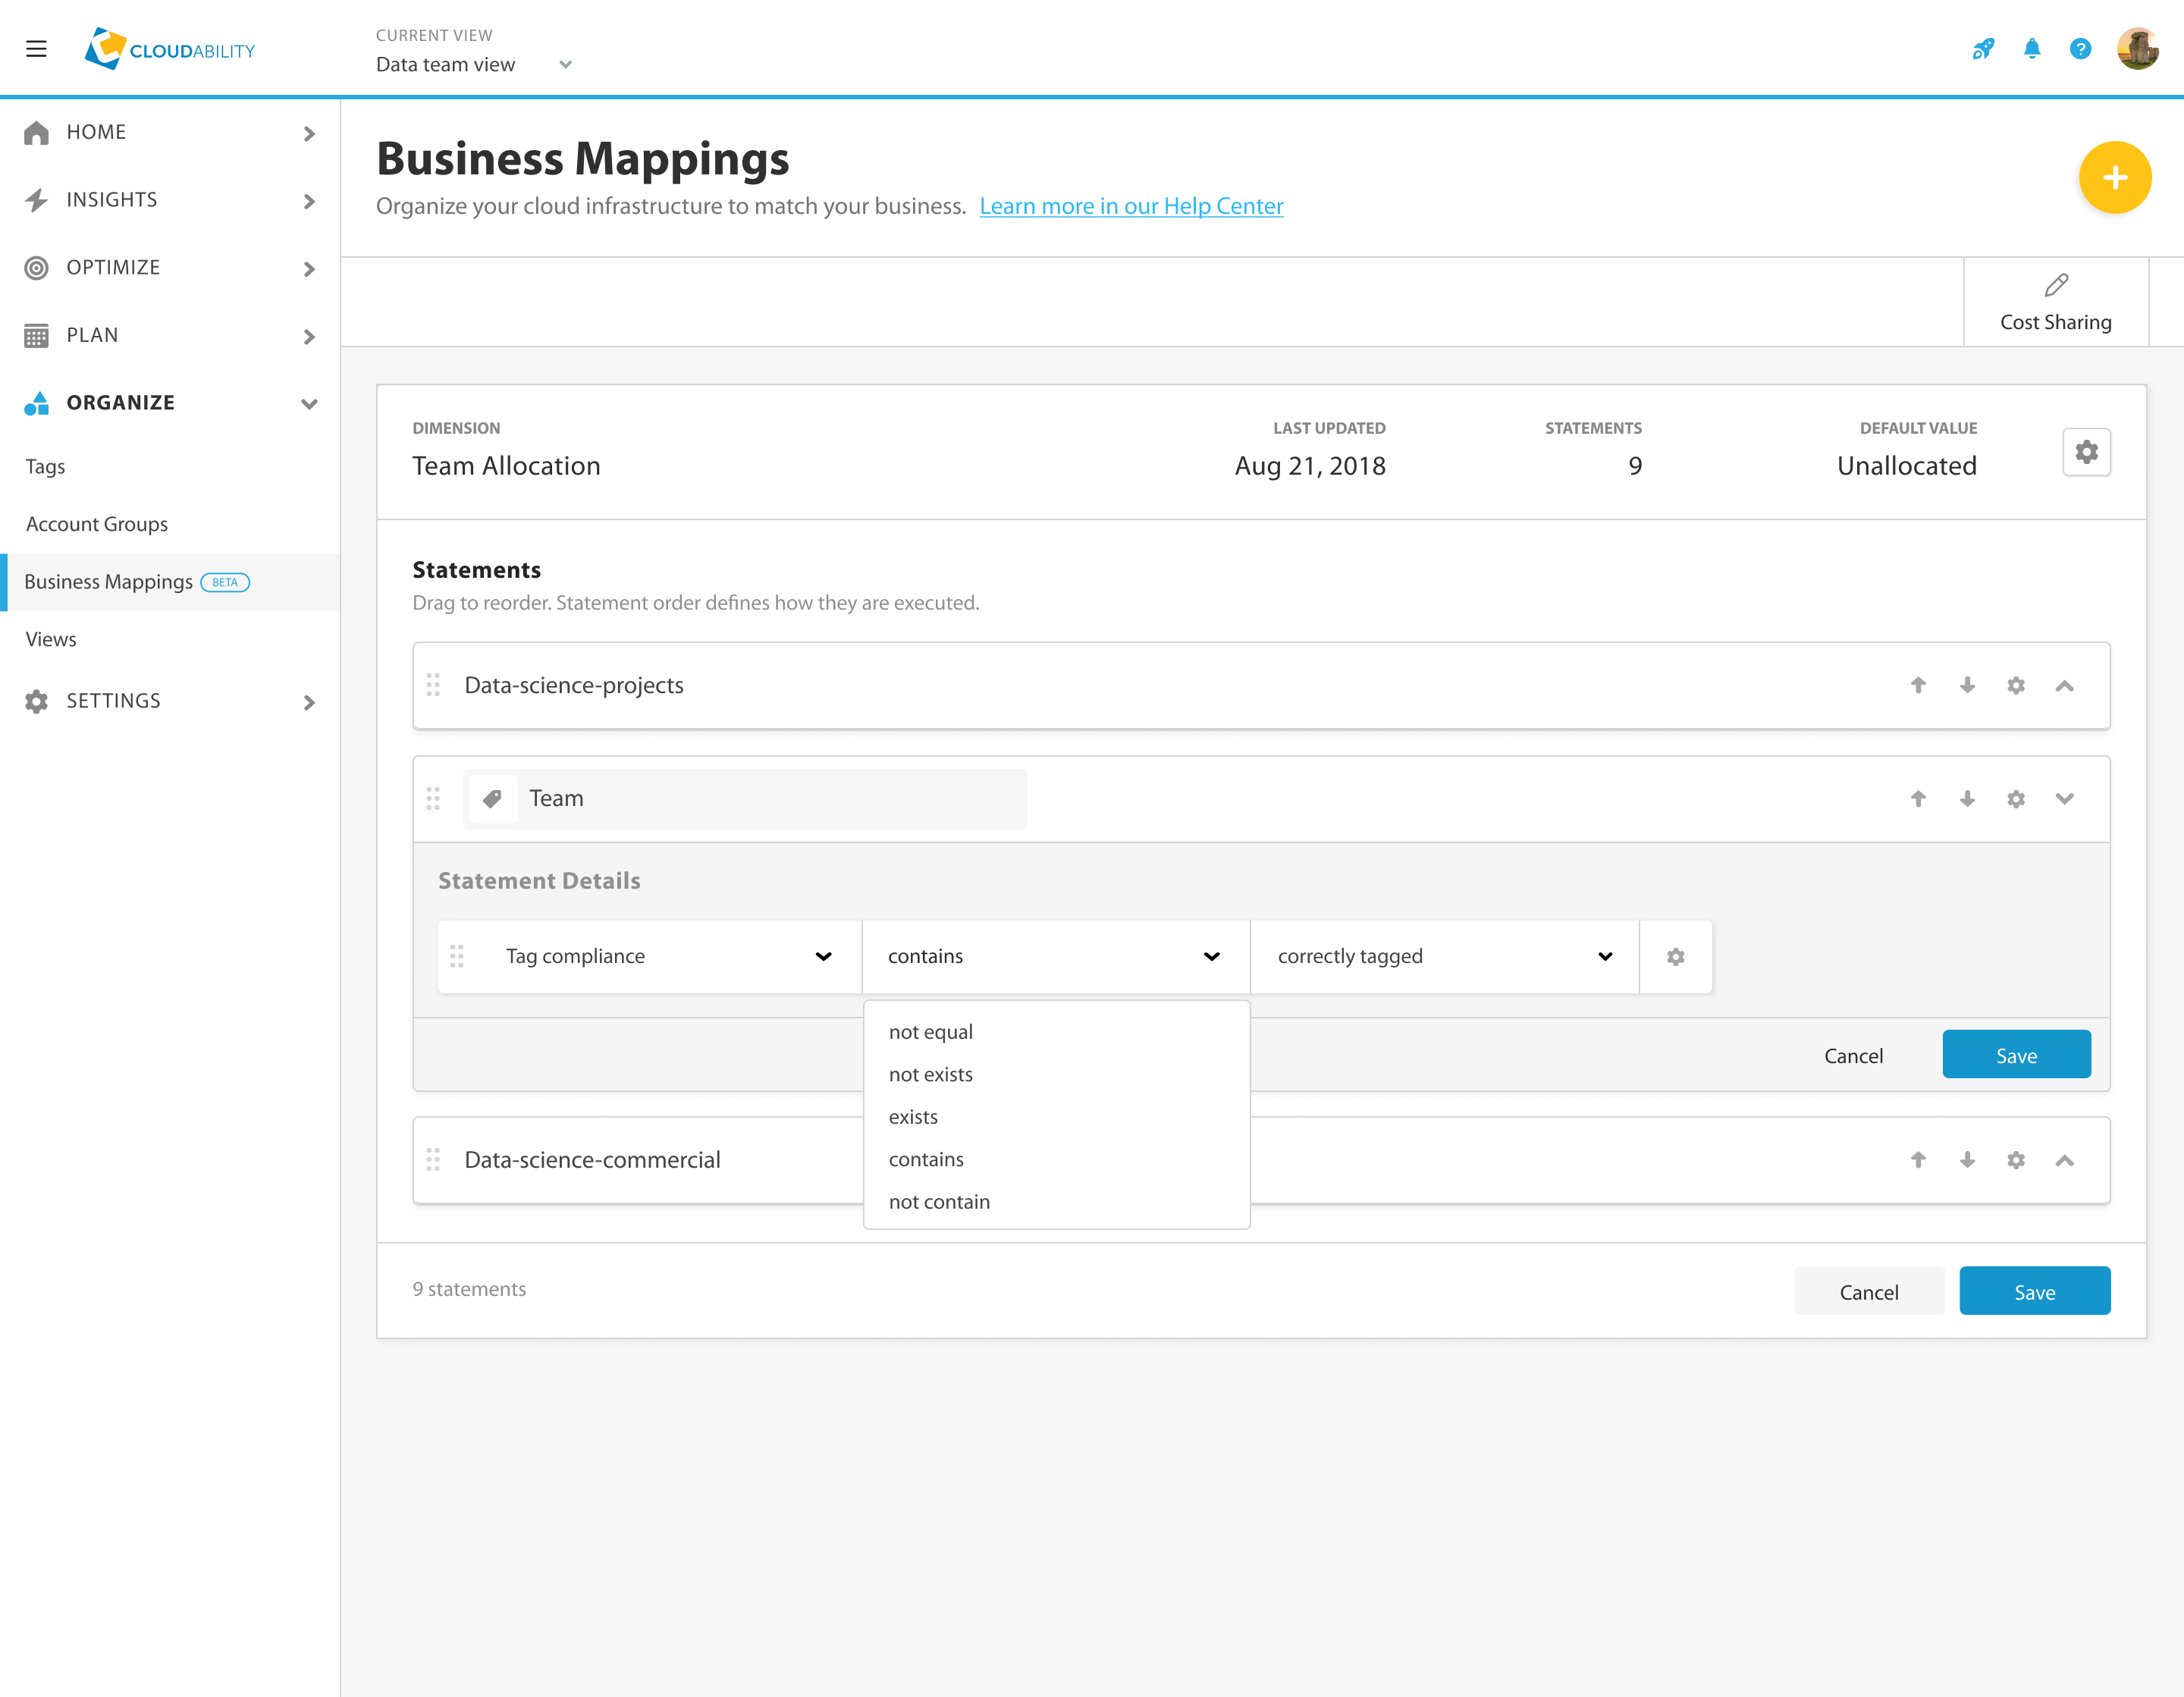
THE PATH TO MVP
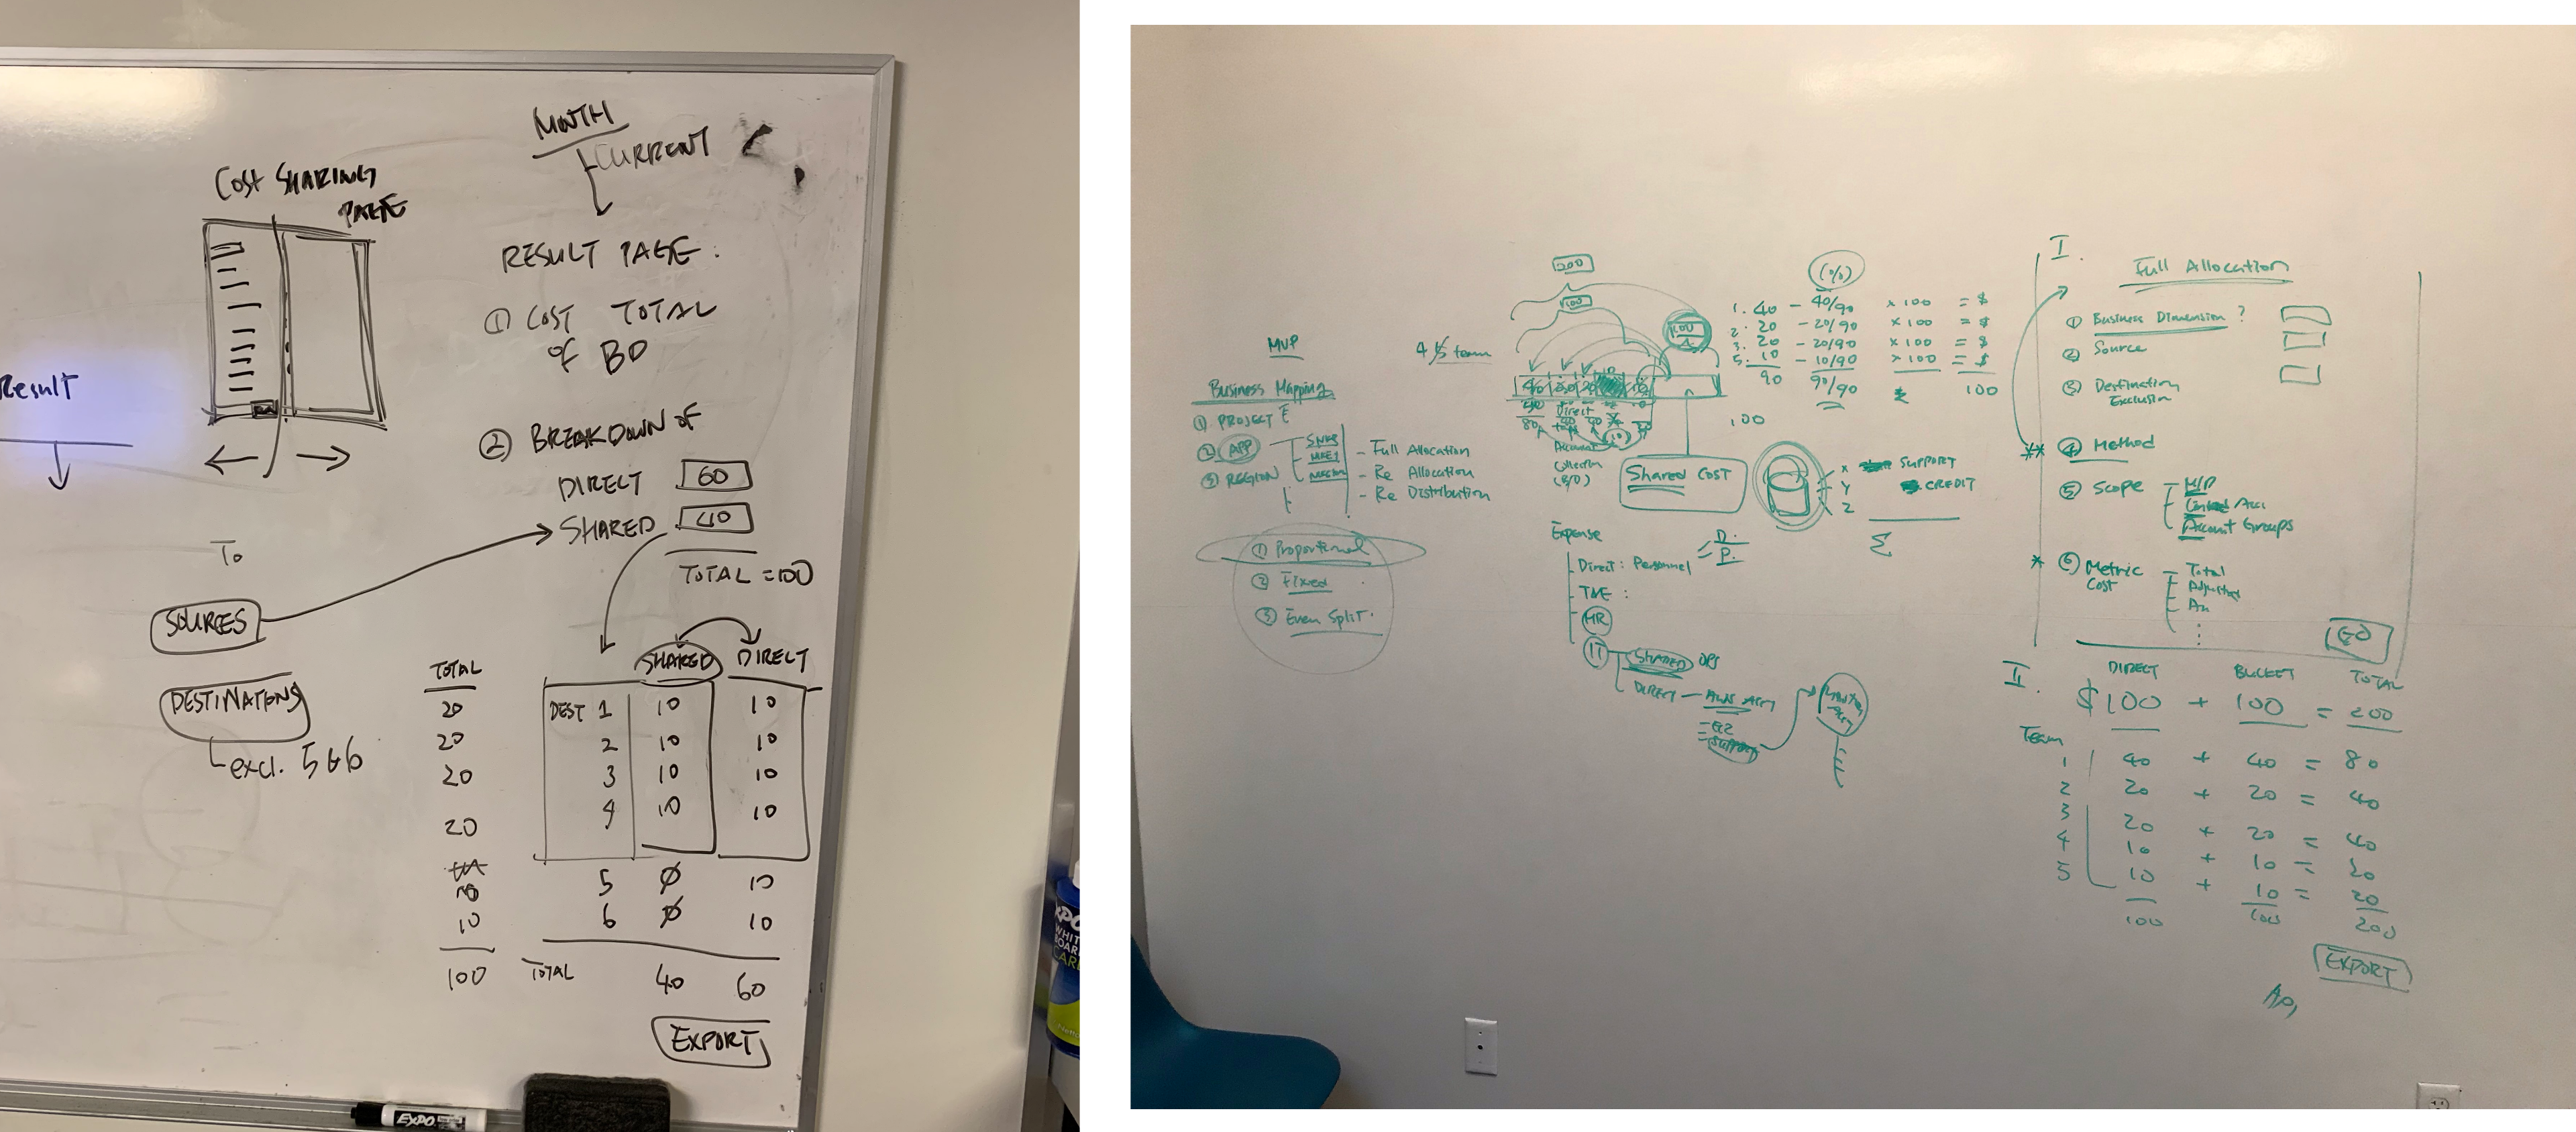
The initial exploration allowed me to get an idea of the user journey and flow. With my initial open questions answered, I can start sketching. I always start with pen and paper to quickly flesh out ideas and validate them. It allows me a way to create quick artifacts to gather feedback from.
USER TESTING & VALIDATION
The goal of user testing was to validate that our display of the cost sharing breakdown is comprehensible, digestible and easy to understand.
- As a user, it clear to the user where shared costs are coming from and how they are distributed across targets within that Business Dimension?
- As a user, is it clear to the user that cost sharing can only be enabled on one Business Dimension at a time?
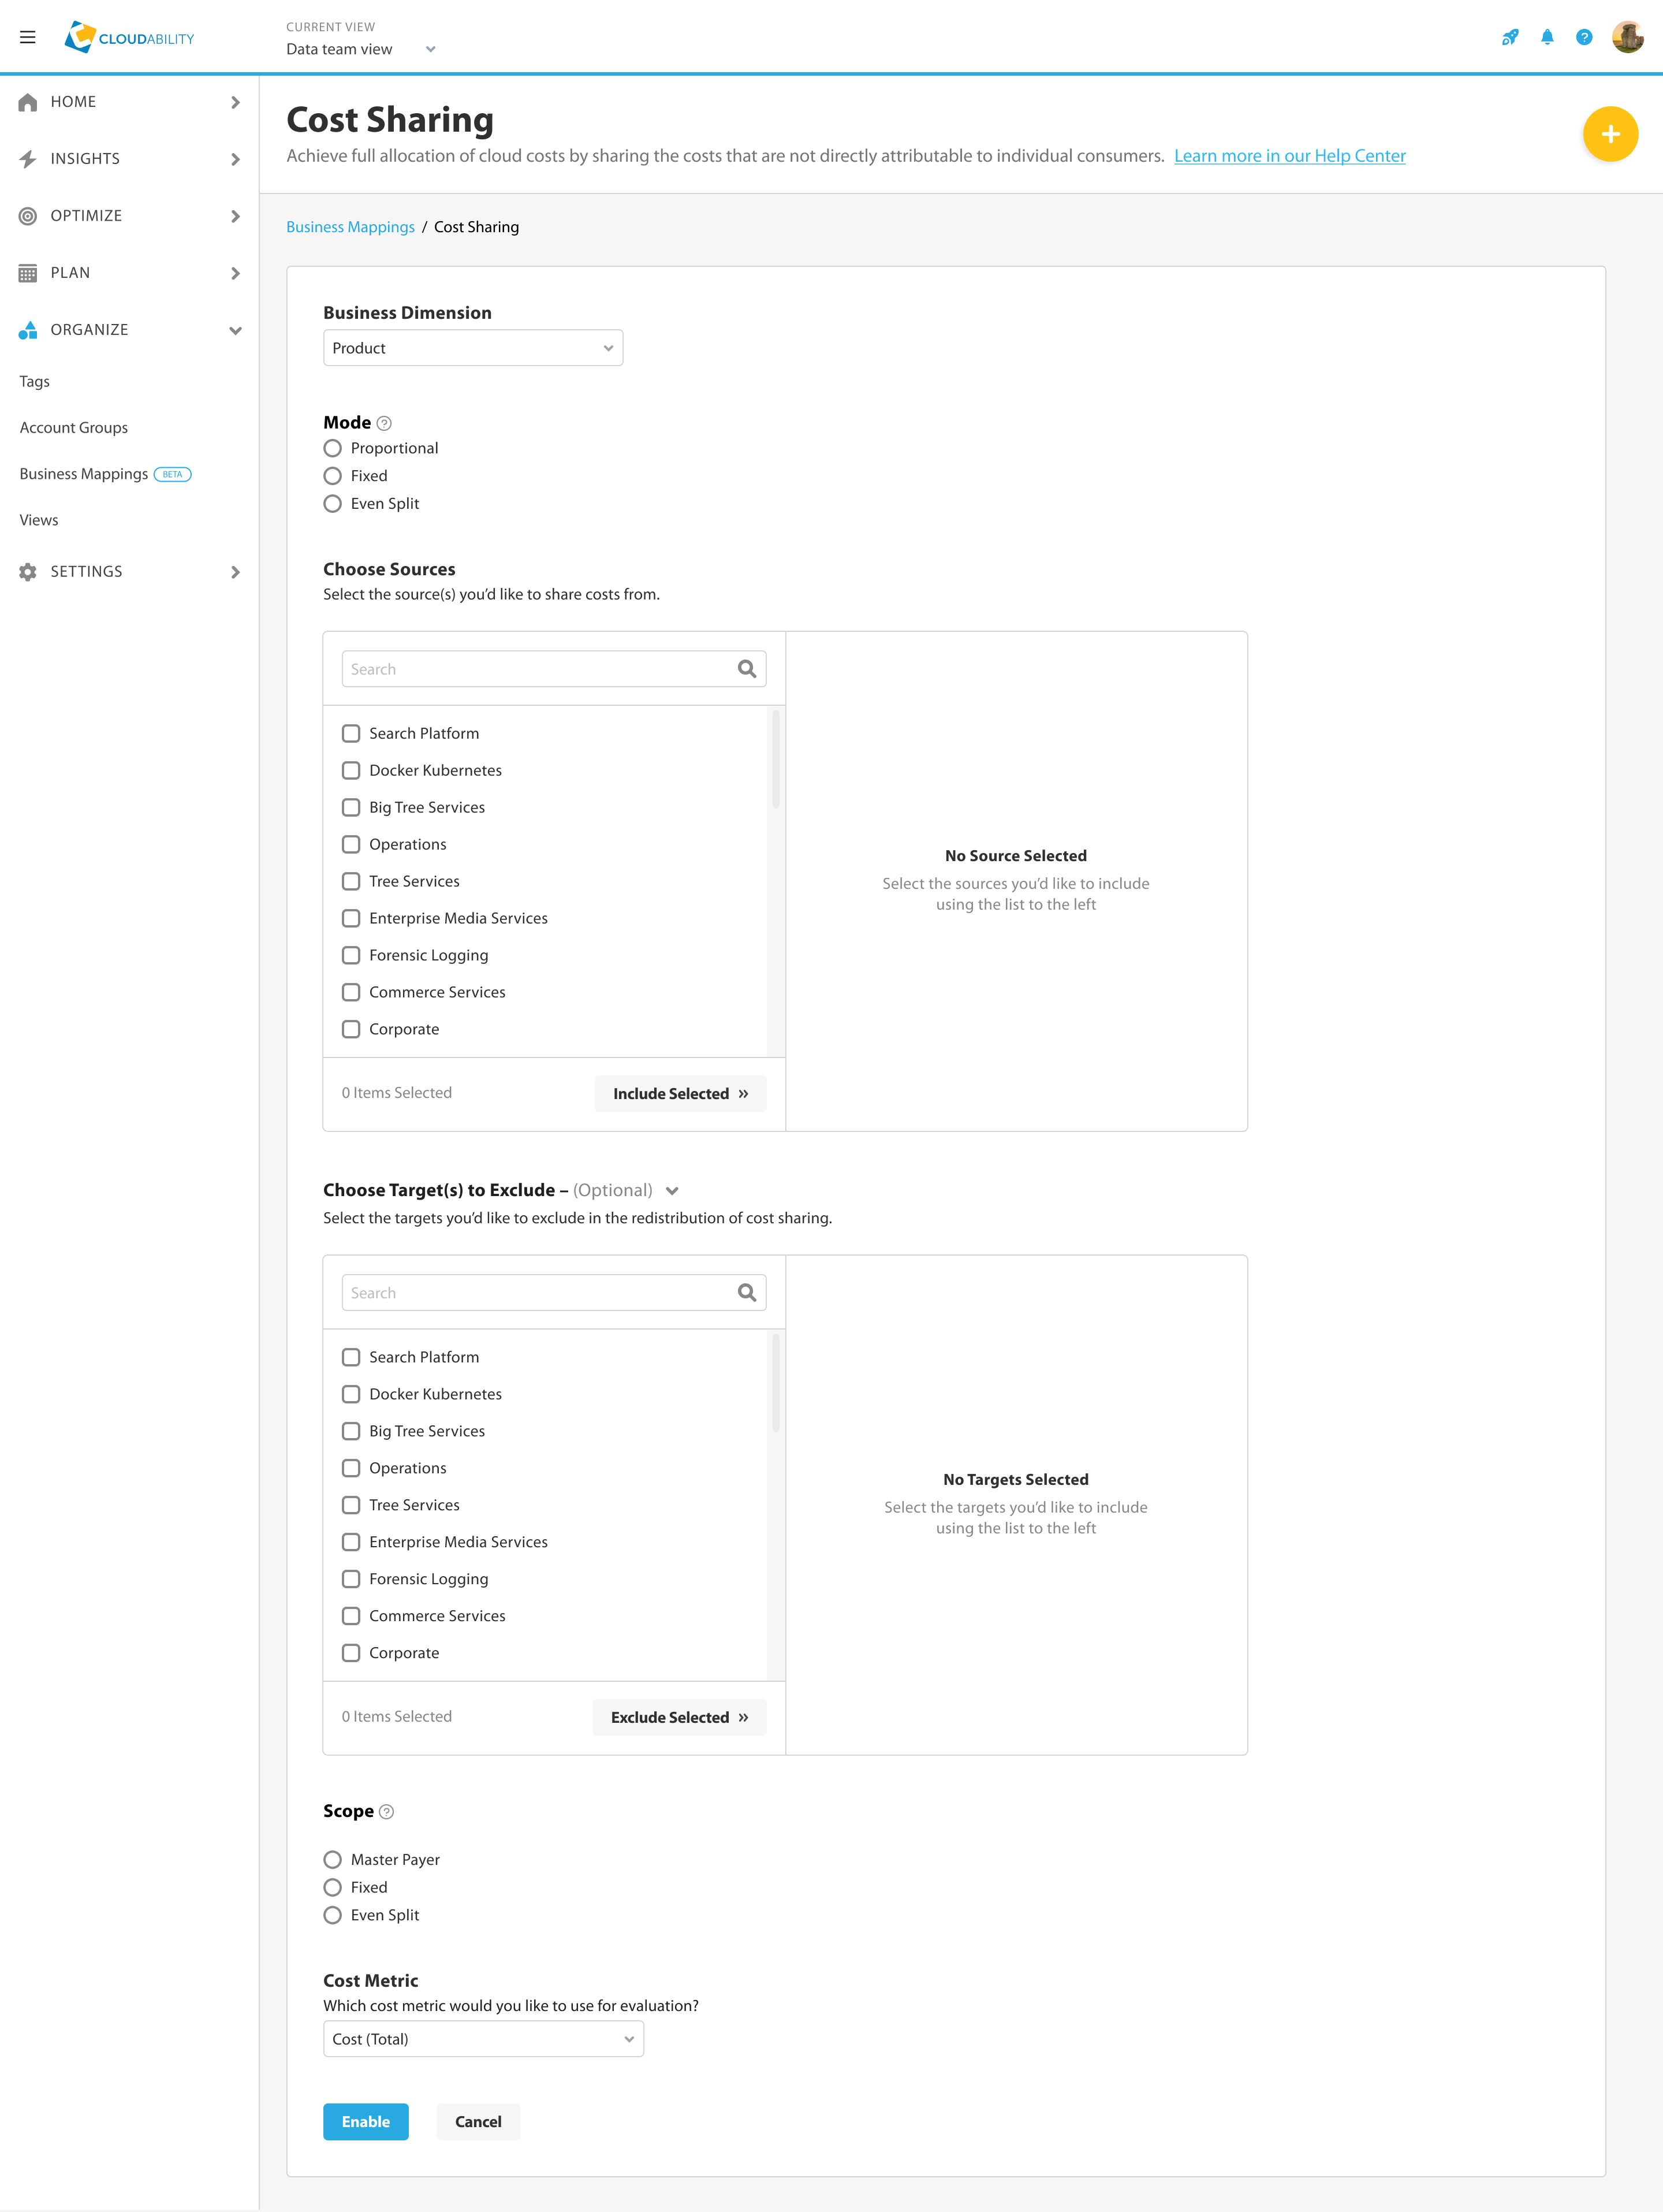
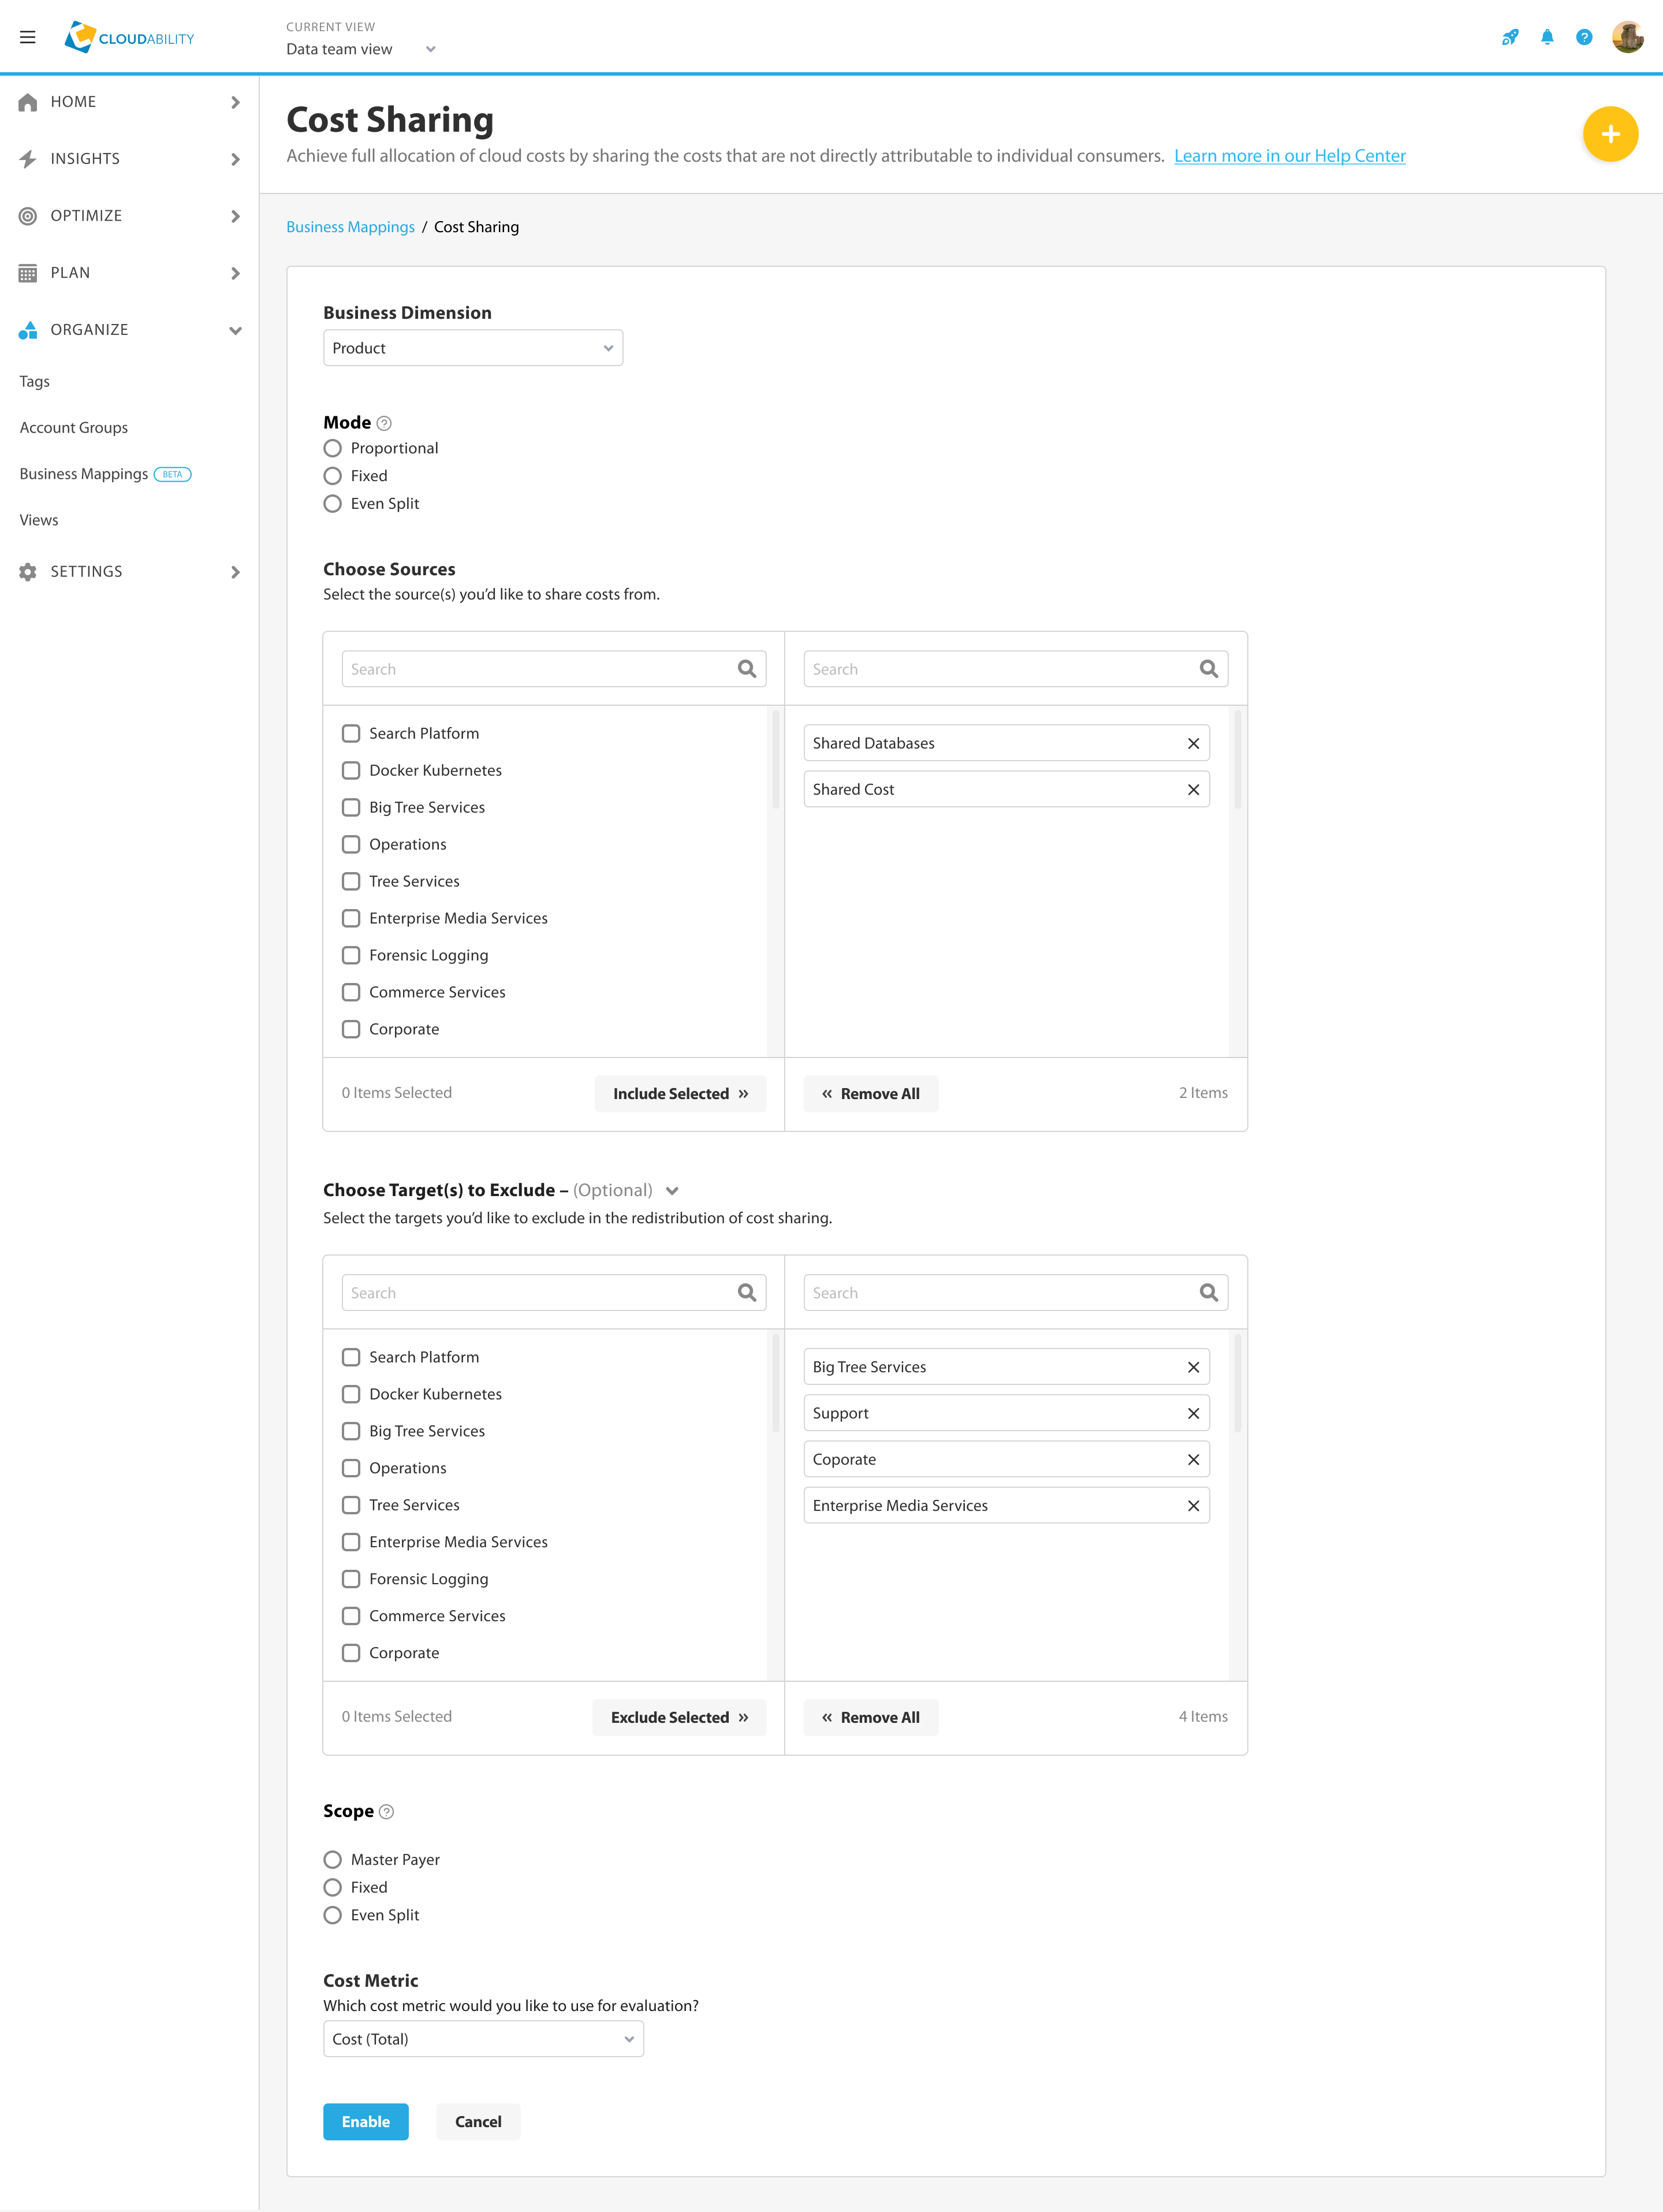
To do this, I constructed a high fidelity prototype in InVision. Because I put a lot of work into creating a modular UI kit within Sketch, it was quick and easy to create something to test in front of users.
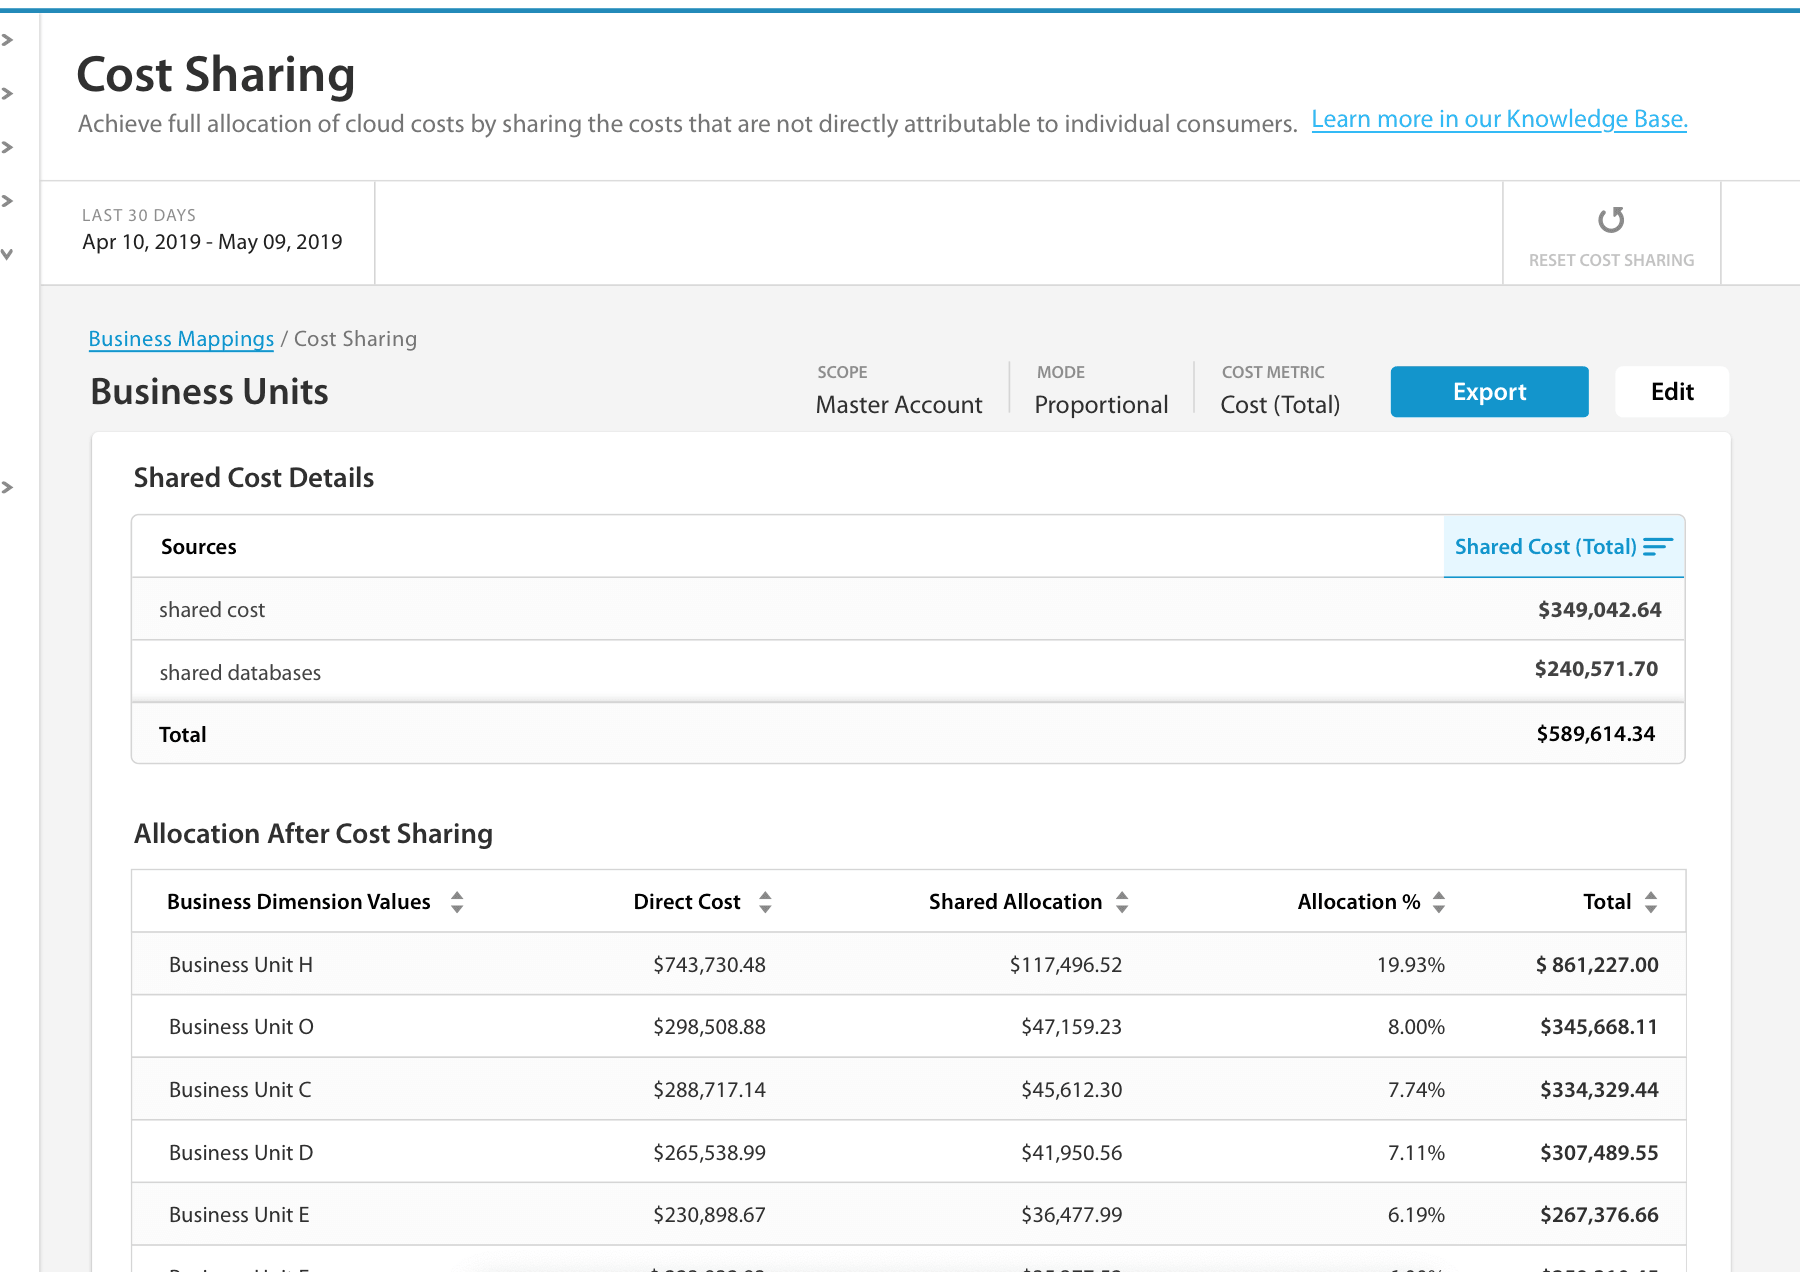
RESULTS
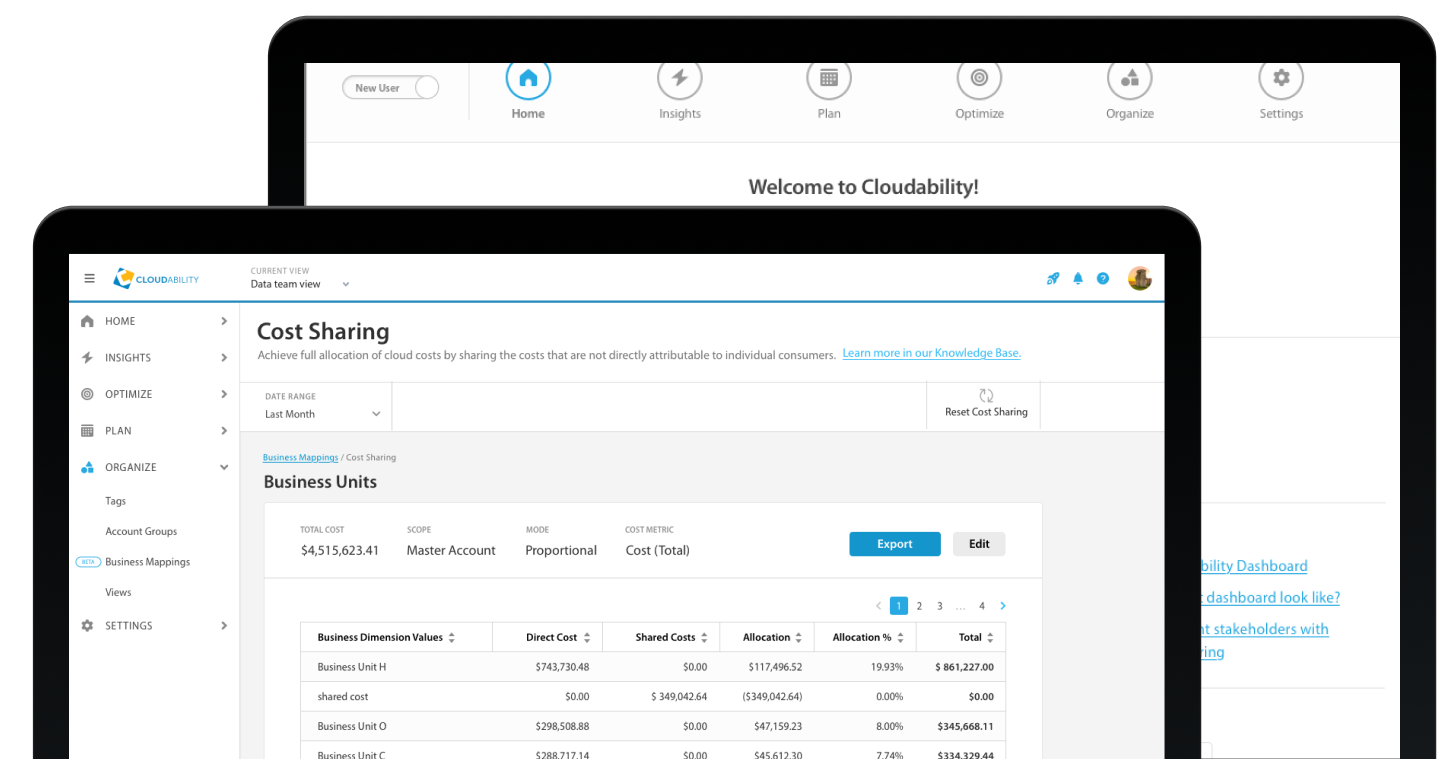
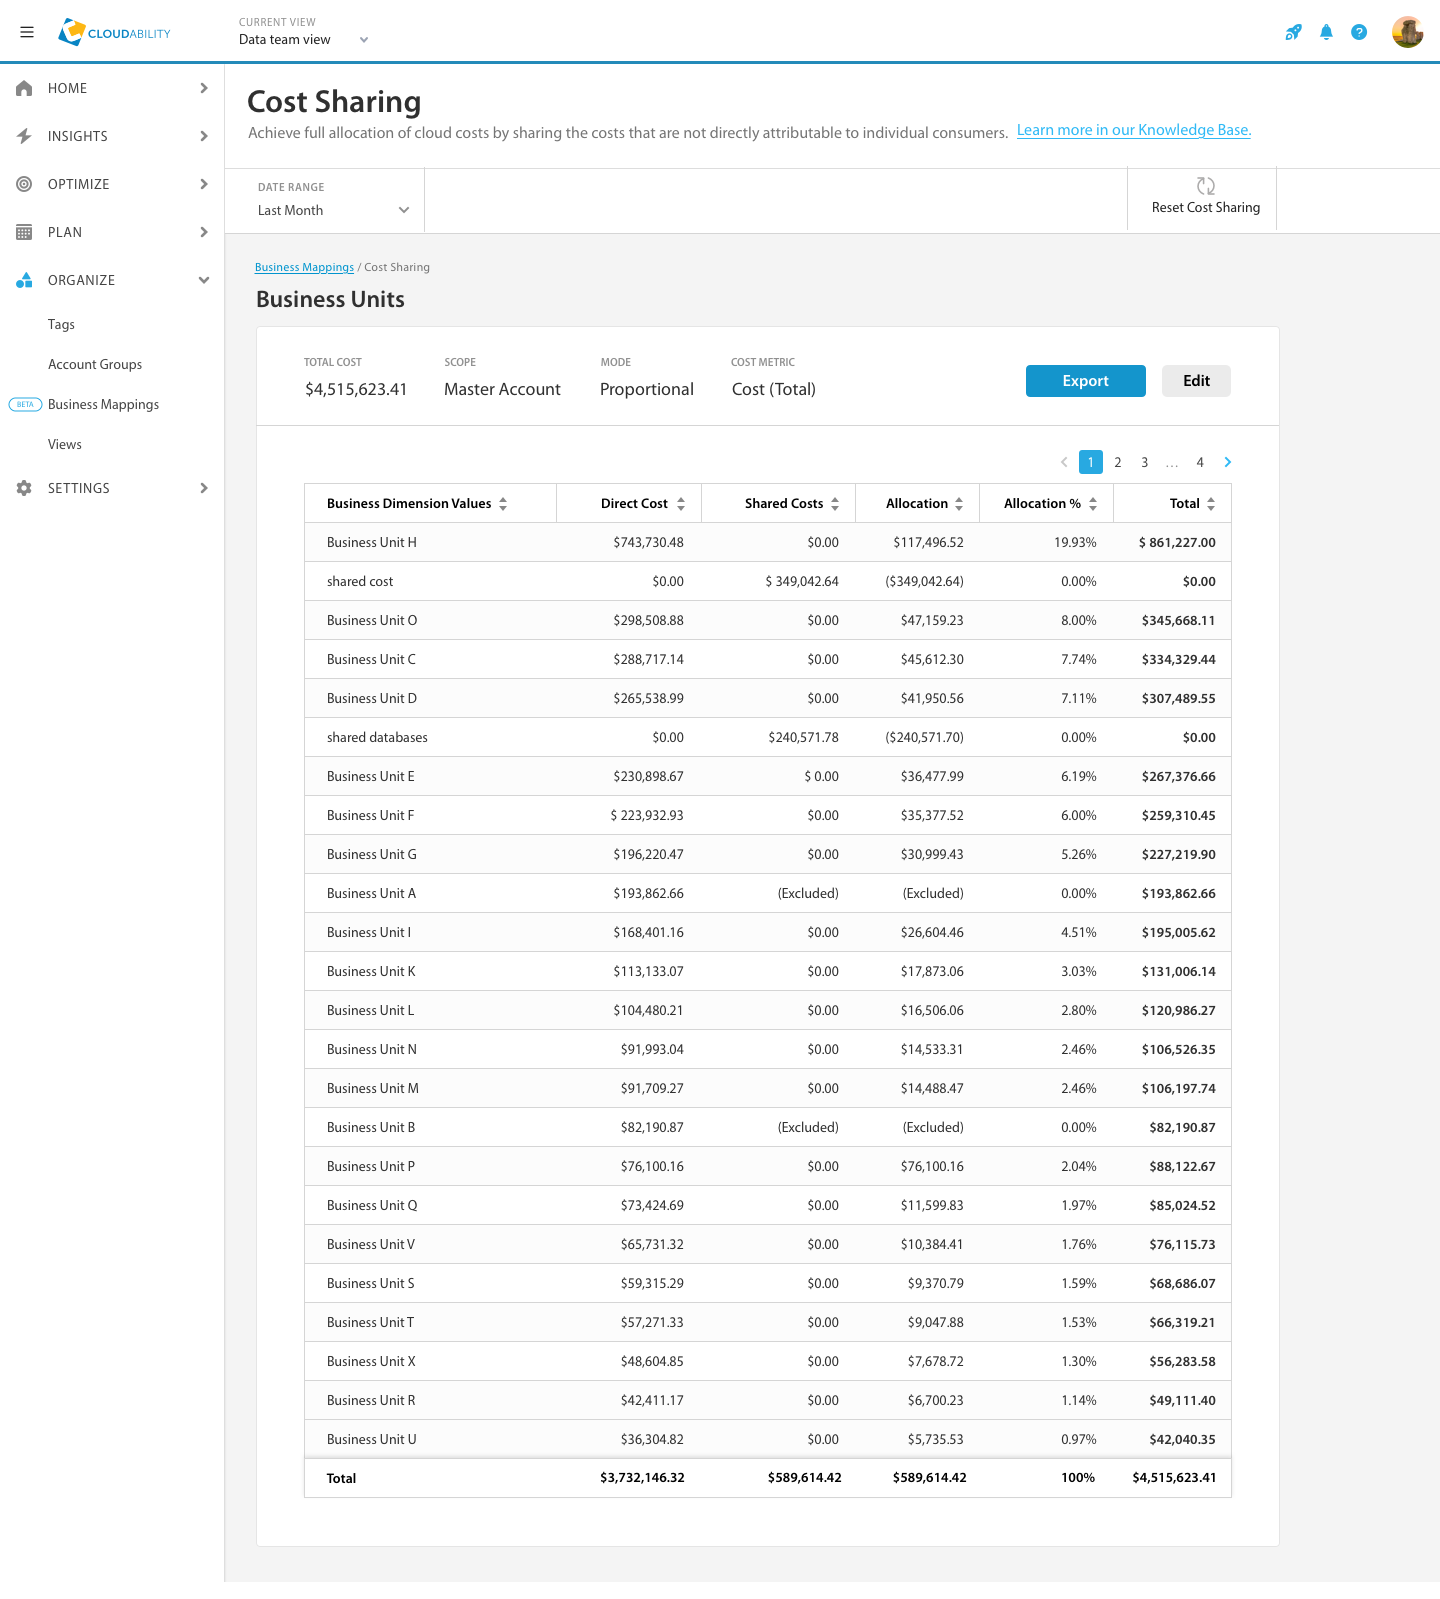
After multiple user tests, we discovered that we needed a more detailed breakdown of the cost sharing data. We were only using one table and including the shared cost information in that table. It was confusing to users what the totals were for shared cost and how they were allocated. We learned that we needed to present the data in a more logical fashion: Your shared costs are one in group (the first table you see below). That cost is then allocated to all the targets below.
USER ADOPTION
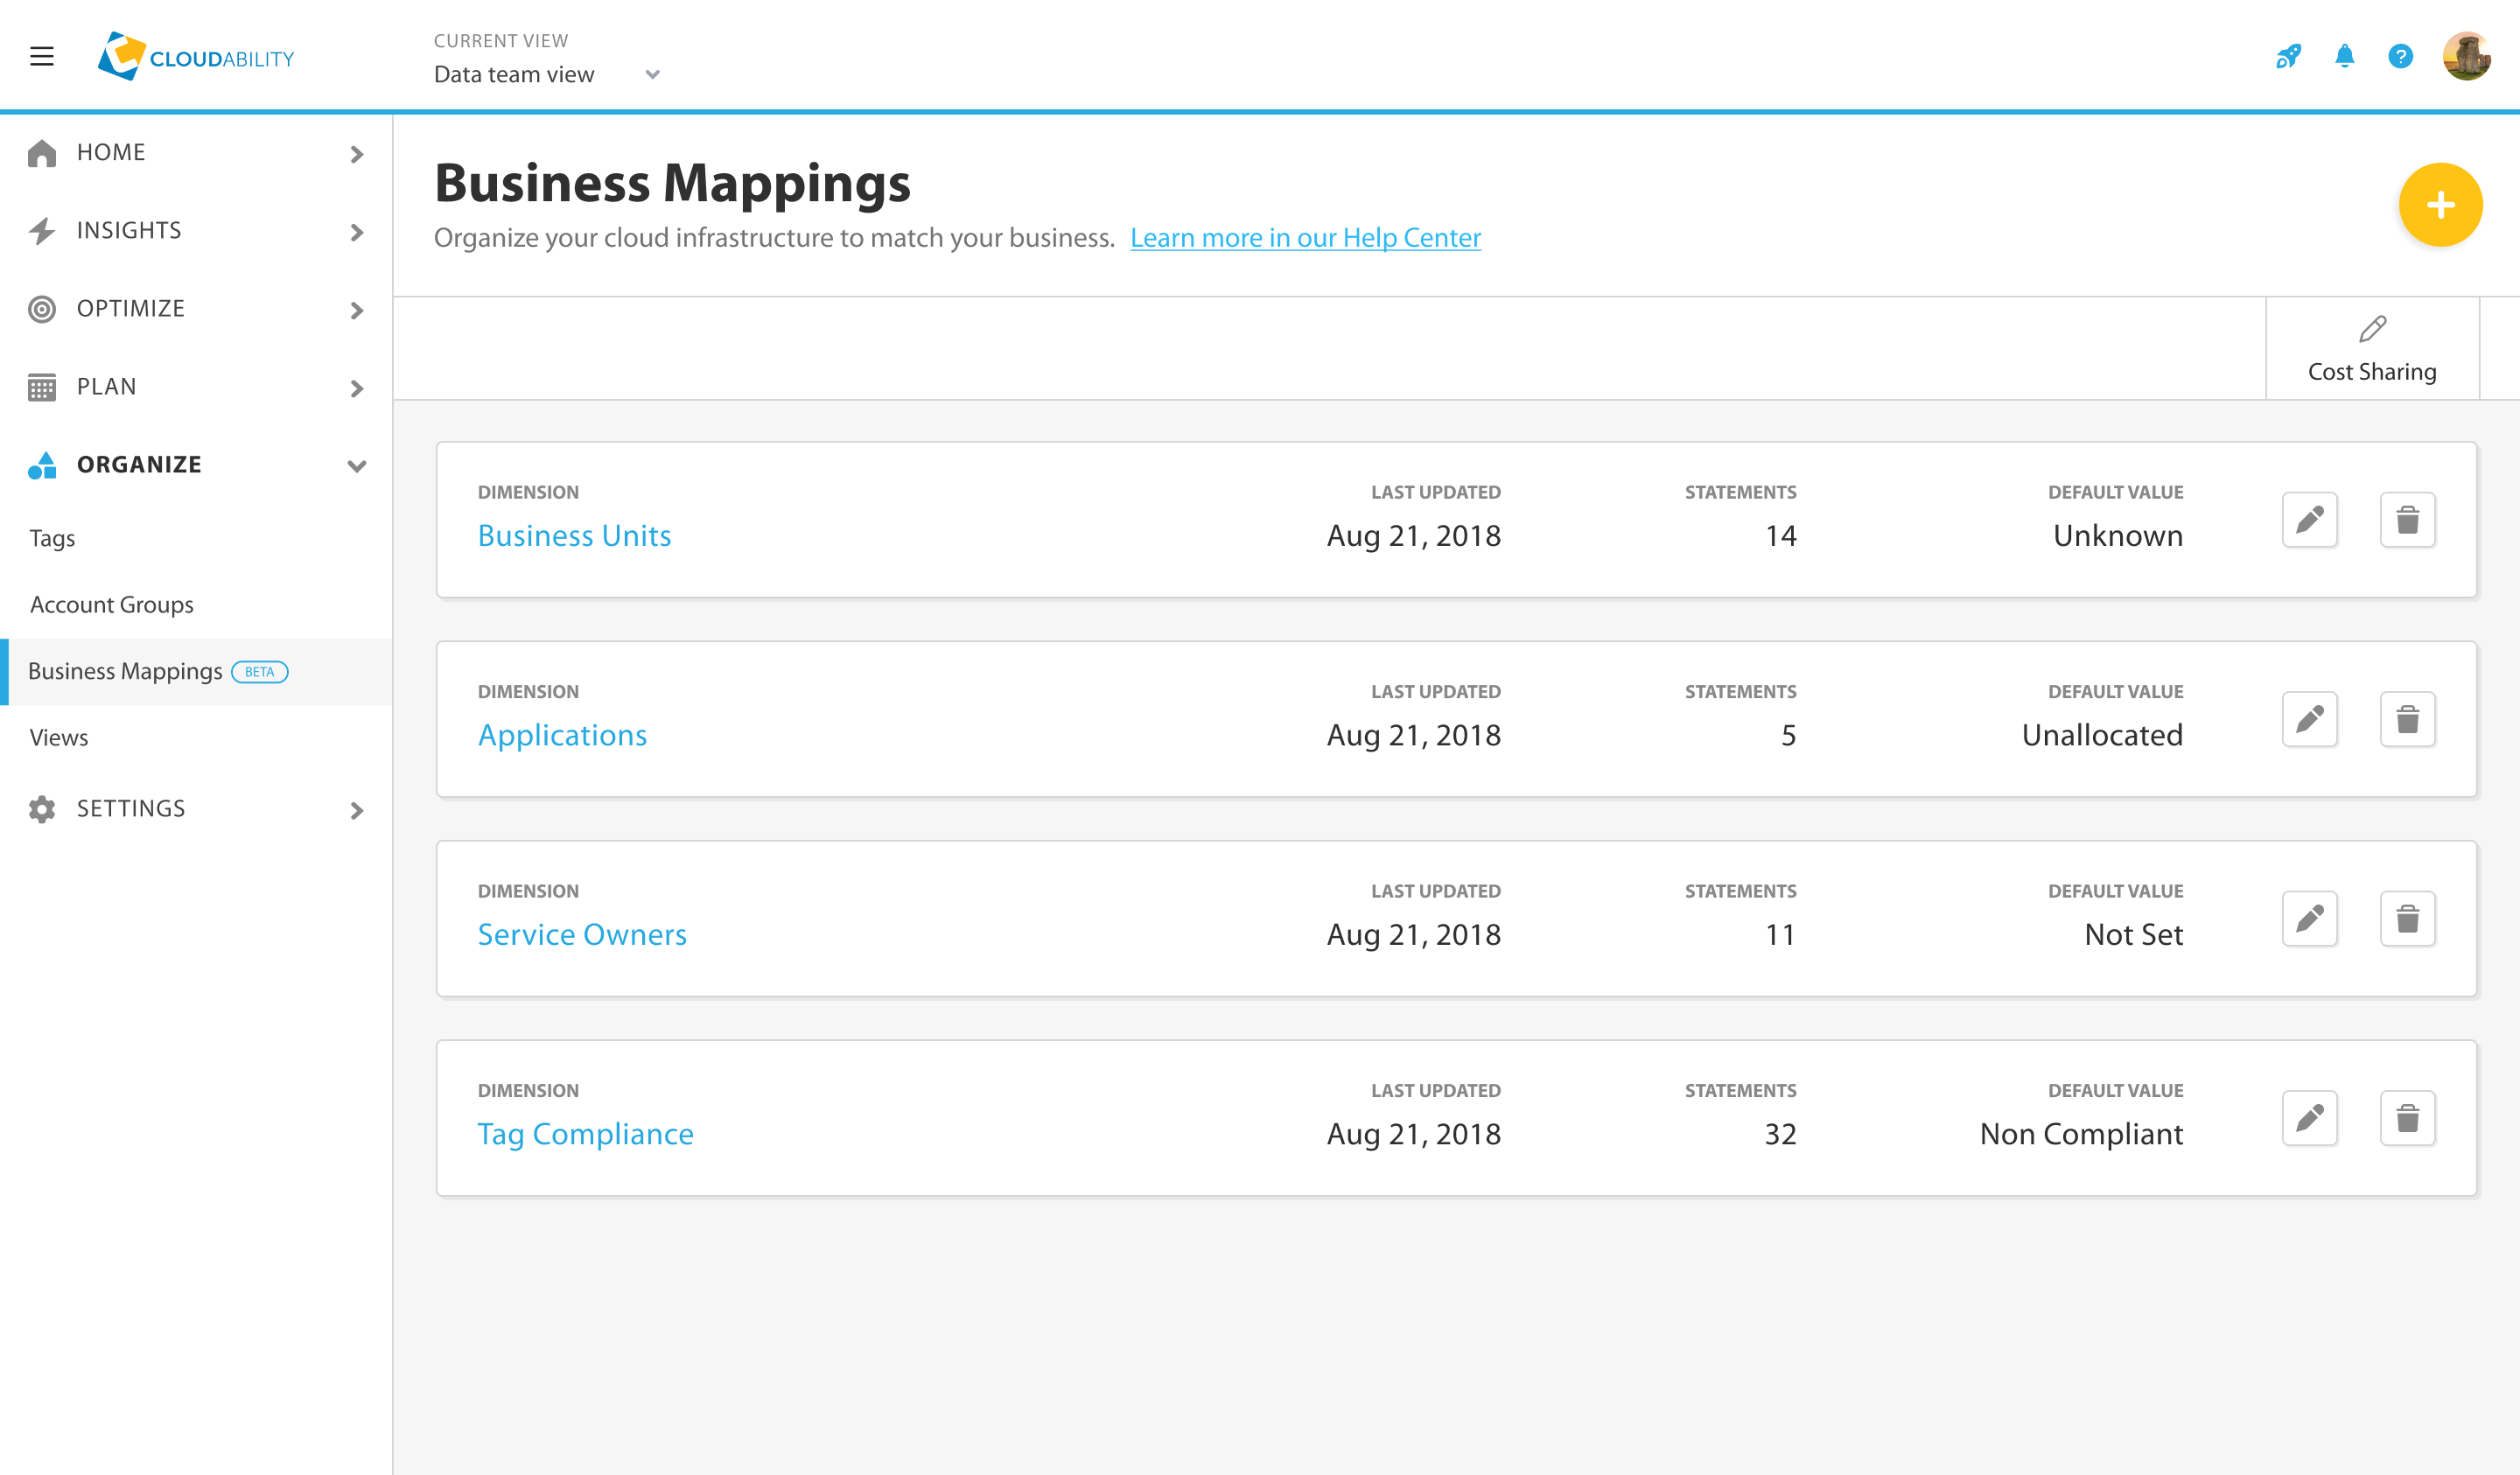
There are currently 10 organizations reaping the benefits of cost sharing within Cloudability. We have received multiple messages from users regarding the amount of time and headaches we have saved them each month thanks to this feature. There are four instances that I know where we closed new deals thanks to the release of Cost Sharing.

FUTURE IMPROVEMENTS
- We made a conscious decision to build this feature outside of our core app and reporting pipeline. This allowed us to build fast, test and iterate at speeds that would typically not be possible.
- For v2, we are looking at incorporating Cost Sharing data into our core app and how that experience would affect other aspects of our data pipeline.
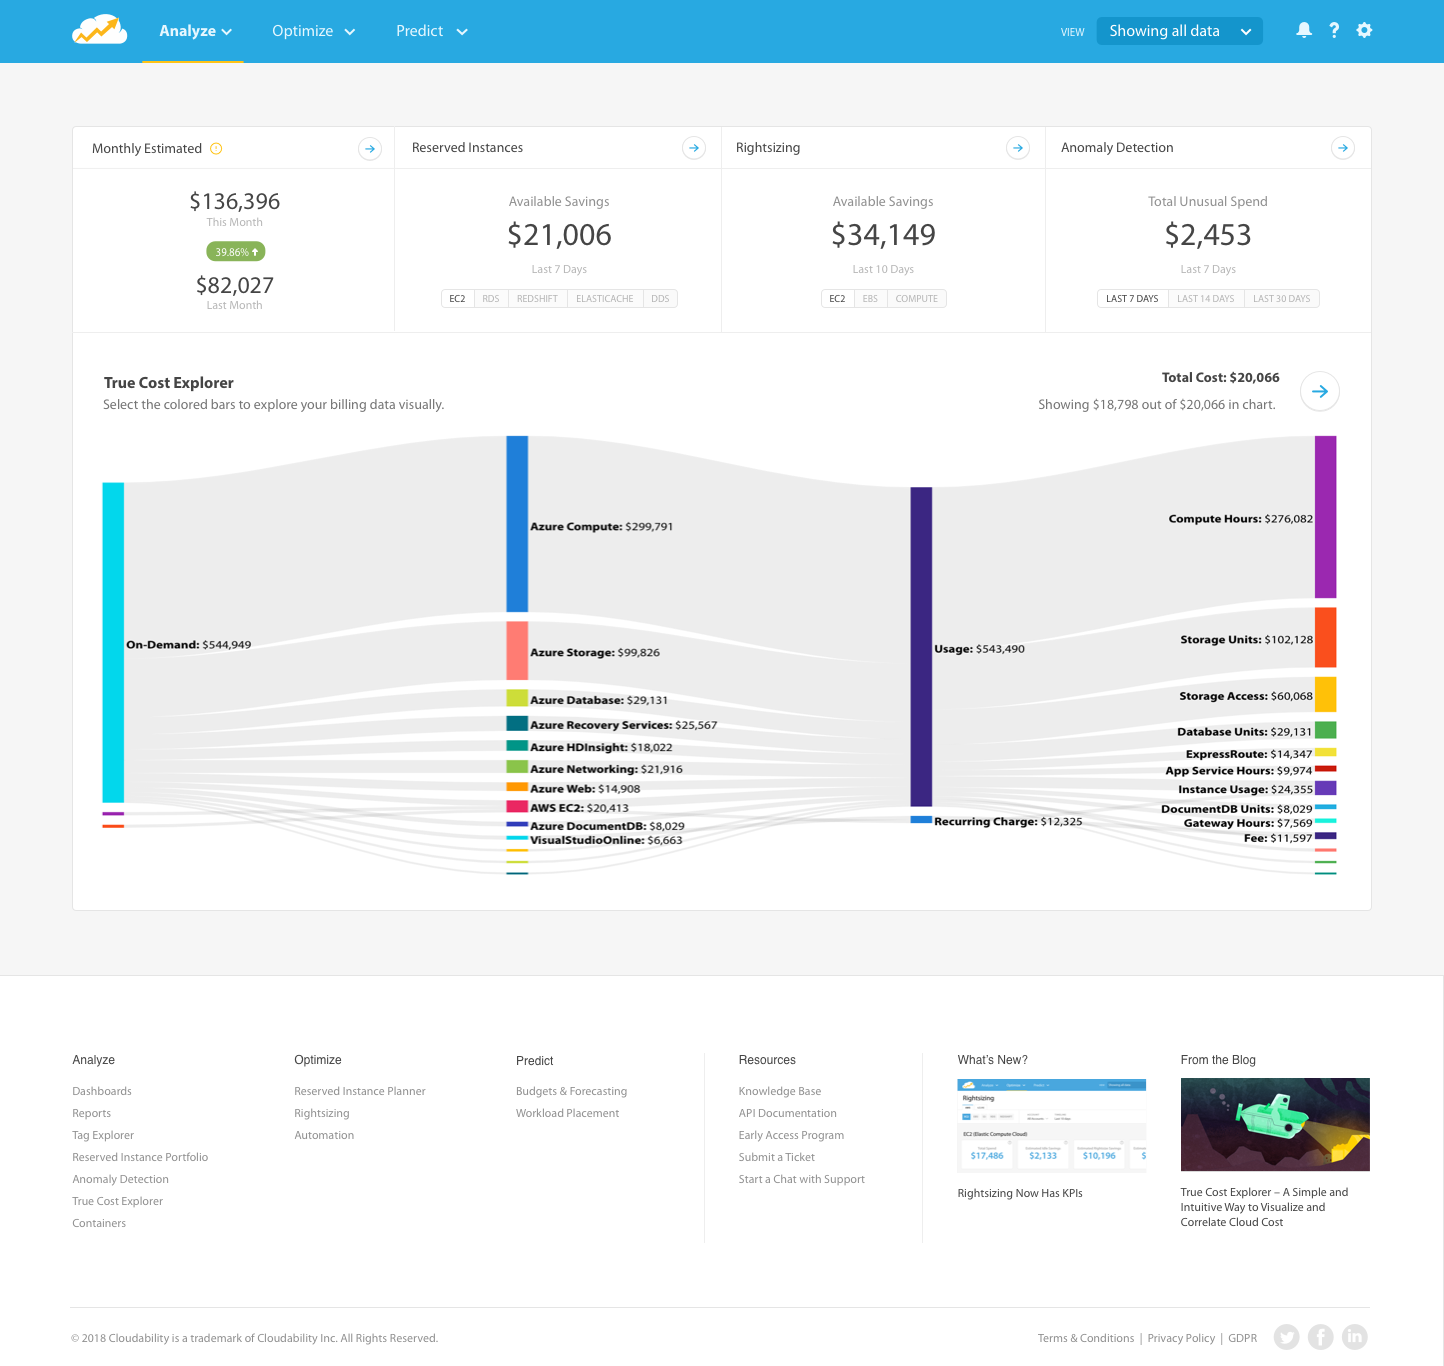
- We are exploring more visual representations of the data is also being considered and tested (as seen in the first screen shot in this case study).
- Feedback from our user tests show that users still want a more granular breakdown of the data. They also want the ability to assign multiple sources and targets, then assign a mode of sharing, then create another and group them all under one Cost Sharing rule.
Below are screens from a few other case studies I worked on...